| ||||||||||||||||
| [Source] | ||||||||||||||||
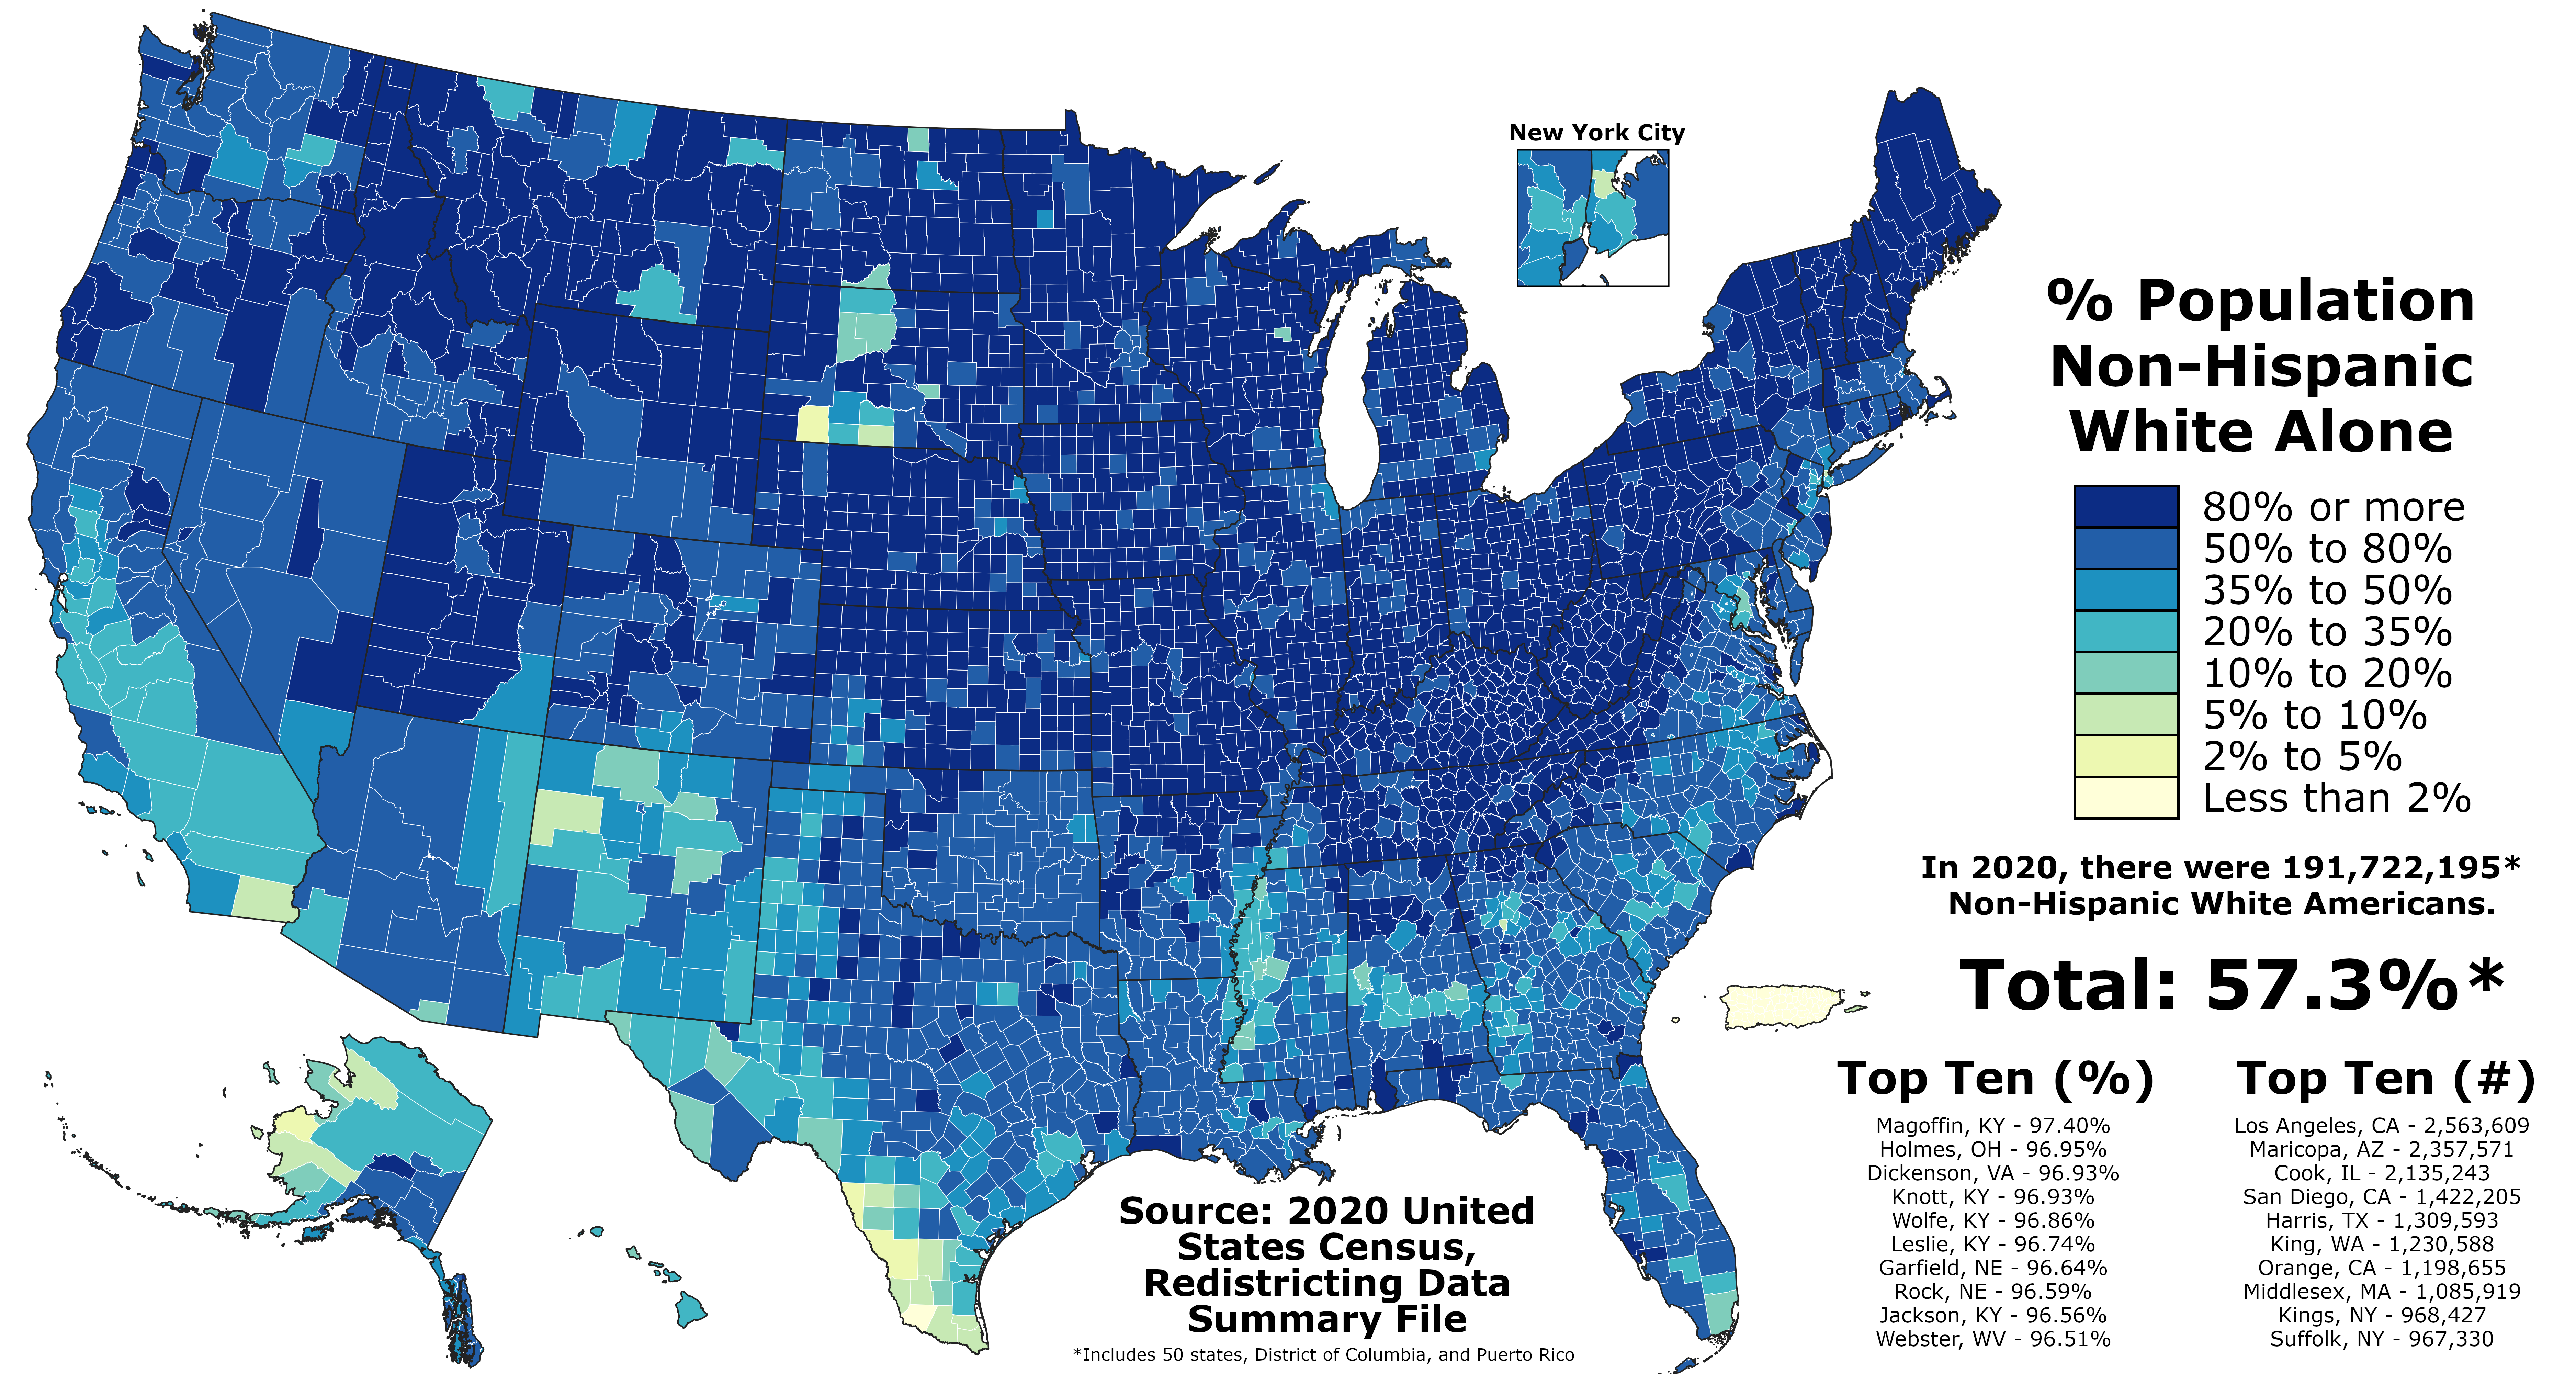
European Americans (also referred to as Euro-Americans) are Americans of European ancestry.[1][2] This term includes people who are descended from the first European settlers in the United States as well as people who are descended from more recent European arrivals. European Americans have been the largest panethnic group in the United States since about the 17th century.
The Spaniards are thought to be the first Europeans to establish a continuous presence in what is now the contiguous United States, with Martín de Argüelles (b. 1566) in St. Augustine, then a part of Spanish Florida,[3][4] and the Russians were the first Europeans to settle in Alaska, establishing Russian America. The first English child born in the Americas was Virginia Dare, born August 18, 1587. She was born in Roanoke Colony, located in present-day North Carolina, which was the first attempt, made by Queen Elizabeth I, to establish a permanent English settlement in North America.
In the 2016 American Community Survey, German Americans (13%), Irish Americans (12%), English Americans (9%), Italian Americans (6%), and Polish Americans (3%) were the five largest self-reported European ancestry groups in the United States, forming over a third of the total population.[5] However, the number of people with British ancestry is considered to be significantly under-counted, as many people in that demographic tend to identify themselves simply as Americans (20,151,829 or 7.2%).[6][7][8][9] The same applies to Americans of Spanish ancestry, as many people in that demographic tend to identify themselves as Hispanic and Latino Americans (58,846,134 or 16.6%), even though they carry a mean of 65.1% European genetic ancestry, mainly from Spain.[10] In the 2000 census over 56 million or 19.9% of the United States population ignored the ancestry question and are classified as "unspecified" and "not reported".[11]
Terminology
| Number of European Americans From 1800 To 2020 | ||||
|---|---|---|---|---|
| Year | Population | % of the United States | Ref(s) | |
| 1800 | 4,306,446 | 81.1% | ||
| 1850 | 19,553,068 | 84.3% | ||
| 1900 | 66,809,196 | 87.9% | ||
| 1950 | 134,942,028 | 89.5% | ||
| 2000 | 211,460,626 | 75.1% | ||
| 2010 | 223,553,265 | 72.4% | ||
Use
In 1995, as part of a review of the Office of Management and Budget's Statistical Policy Directive No. 15 (Race and Ethnic Standards for Federal Statistics and Administrative Reporting), a survey was conducted of census recipients to determine their preferred terminology for the racial/ethnic groups defined in the Directive. For the White group, European American came a distant third, preferred by only 2.35% of panel interviewees, as opposed to White, which was preferred by 61.66%.[12]
The term is sometimes used interchangeably with Caucasian American, White American, and Anglo American in many places around the United States.[13] However, the terms Caucasian and White are racial terms, not geographic, and include some populations whose origin is outside of Europe; and Anglo-American also has another definition, meaning Americans with English ancestry.
Origin
The term is used by some to emphasize this demographic's European cultural and geographical as well as ancestral origins, parallelling terms such as African Americans and Asian Americans.[Citation needed]
In contexts such as medical research, terms such as "white" and "European" have been criticized for vagueness and blurring important distinctions between different groups that happen to fit within the label.[14] Margo Adair suggests that viewing Americans of European descent as a single group contributes to the "Wonder breading" of the United States, eradicating the cultural heritage of individual European ethnicities.[15]
Subgroups
There are a number of subgroupings of European Americans.[16] While these categories may be approximately defined, often due to the imprecise or cultural regionalization of Europe, the subgroups are nevertheless used widely in cultural or ethnic identification.[17] This is particularly the case in diasporic populations, as with European people in the United States generally.[18] In alphabetical order, some of the subgroups are:
- Northwestern European Americans, including Austrian Americans, Belgian Americans, British Americans (Cornish Americans, English Americans, Manx Americans, Scotch-Irish Americans, Scottish Americans, Welsh Americans), Dutch Americans, French Americans, German Americans, Irish Americans, Luxembourgish Americans, Scandinavian Americans (Danish Americans, Finnish Americans, Icelandic Americans, Norwegian Americans, Swedish Americans) and Swiss Americans, or "Old Immigrants" (the first waves of which arrived pre-1881)
- Eastern European Americans, including Belarusian Americans, Czech Americans, Estonian Americans, Hungarian Americans, Latvian Americans, Lithuanian Americans, Polish Americans, Russian Americans, Slovak Americans, and Ukrainian Americans, or "New Immigrants" (the first large waves of which arrived 1881-1965)
- Southern European Americans, including Albanian Americans, Bosnian Americans, Bulgarian Americans, Croatian Americans, Cypriot Americans, Greek Americans, Italian Americans, Kosovan Americans, Maltese Americans, Macedonian Americans, Moldovan Americans, Montenegrin Americans, Portuguese Americans, Romanian Americans, Serbian Americans, Slovenian Americans, and Spanish Americans (Asturian Americans, Basque Americans, Canarian Americans, Catalan Americans, Galician Americans), also "New Immigrants" (the first large waves of which arrived 1881-1965)
History
| Historical immigration / est. origins | ||
|---|---|---|
| Country | Immigration before 1790 |
Population ancestry: 1790[19] |
| England* | 230,000 | 1,900,000 |
| Ulster Scotch-Irish* | 135,000 | 320,000 |
| Germany[lower-alpha 1] | 103,000 | 280,000 |
| Scotland* | 48,500 | 160,000 |
| Ireland | 8,000 | 200,000 |
| Netherlands | 6,000 | 100,000 |
| Wales* | 4,000 | 120,000 |
| France | 3,000 | 80,000 |
| Sweden and Other[lower-alpha 2] | 500 | 20,000 |
| *Totals, British | 417,500 | 2,500,000+ |
| 950,000 | 3,929,214 | |
| Source:[20](excludes African population.) | ||
Before the arrival of Europeans in the United States, the Native Americans predominantly inhabited the United States. The Native Americans died of European diseases such as small pox. Europeans killed an estimated 90% of Native Americans.[21] The first Europeans to invade North America were the Spanish. The Spanish’s first invasion was in 1565 at St. Augustine, Florida.[22] The most significant early explorers was from Spain Hernando De Soto, a Spanish explorer and conquistador who had accompanied Spanish conquistador Francisco Pizzaro during the his conquest of Peru. Leaving Havana, Cuba in 1539, De Soto's expedition landed in the state of Florida and ranged through the southeastern area in the United States as far as the Mississippi River in search of riches and fortune. Another Spaniard who initially explored the United States, Francisco Coronado, set out from the country Mexico in 1540 in search of the mythical Seven Cities of Cibola. Coronado's had traveled to Kansas and the Grand Canyon, but had failed to reveal the gold or treasure his men were looking for. Coronado left a gift of horses to the Plains Indians. Italian explorer Giovanni da Verrazano and Frenchman Jacques Cartier are other Europeans who initially explored the United States. The Spanish, viewed the French as a threat to their trade route along the Gulf Stream.[23]
Since 1607, some 57 million immigrants have come to the United States from other lands. Approximately 10 million passed through on their way to some other place or returned to their original homelands, leaving a net gain of some 47 million people.[24]
Shifts in European migration
Before 1881, the vast majority of immigrants, almost 86% of the total, arrived from northwest Europe, principally Great Britain, Ireland, Germany, and Scandinavia, known as "Old Immigration". The years between 1881 and 1893 the pattern shifted, in the sources of U.S. "New Immigration". Between 1894 and 1914, immigrants from southern, central, and eastern Europe accounted for 69% of the total.[25][26][27] Prior to 1960, the overwhelming majority came from Europe or of European descent from Canada. Immigration from Europe as a proportion of new arrivals has been in decline since the mid-20th century, with 75.0% of the total foreign-born population born in Europe compared to 12.1% recorded in the 2010 census.[28]
Immigration since 1820
| European immigration to the U.S. 1820–1970 | |||||
|---|---|---|---|---|---|
| Years | Arrivals | Years | Arrivals | Years | Arrivals |
| 1820–1830 | 98,816 | 1901–1910 | 8,136,016 | 1981–1990 | |
| 1831–1840 | 495,688 | 1911–1920 | 4,376,564 | 1991–2000 | |
| 1841–1850 | 1,597,502 | 1921–1930 | 2,477,853 | ||
| 1851–1860 | 2,452,657 | 1931–1940 | 348,289 | ||
| 1861–1870 | 2,064,407 | 1941–1950 | 621,704 | ||
| 1871–1880 | 2,261,904 | 1951–1960 | 1,328,293 | ||
| 1881–1890 | 4,731,607 | 1961–1970 | 1,129,670 | ||
| 1891–1900 | 3,558,793 | 1971–1980 | |||
| Arrivals | Total (150 yrs) | 35,679,763 | |||
| Source:[29][30][31][32][33] | |||||
| Country of origin 1820–1978 | |||||
|---|---|---|---|---|---|
| Country | Arrivals | % of total | Country | Arrivals | % of total |
| Germany1 | 6,978,000 | 14.3% | Norway | 856,000 | 1.8% |
| Italy | 5,294,000 | 10.9% | France | 751,000 | 1.5% |
| Great Britain | 4,898,000 | 10.01% | Greece | 655,000 | 1.3% |
| Ireland | 4,723,000 | 9.7% | Portugal | 446,000 | 0.9% |
| Austria-Hungary1, 2 | 4,315,000 | 8.9% | Denmark | 364,000 | 0.7% |
| Russia1, 2 | 3,374,000 | 6.9% | Netherlands | 359,000 | 0.7% |
| Sweden | 1,272,000 | 2.6% | Finland | 33,000 | 0.1% |
| Total (158 yrs) | 34,318,000 | ||||
| Source:[34][35][36] Note: Many returned to their country of origin | |||||
- European-born population
The figures below show that of the total population of specified birthplace in the United States. A total of 11.1% were born-overseas of the total population.
| Population / Proportion born in Europe in 1850–2016 | |||
|---|---|---|---|
| Year | Population | % of foreign-born | |
| 1850 | 2,031,867 | 92.2% | |
| 1860 | 3,807,062 | 92.1% | |
| 1870 | 4,941,049 | 88.8% | |
| 1880 | 5,751,823 | 86.2% | |
| 1890 | 8,030,347 | 86.9% | |
| 1900 | 8,881,548 | 86.0% | |
| 1910 | 11,810,115 | 87.4% | |
| 1920 | 11,916,048 | 85.7% | |
| 1930 | 11,784,010 | 83.0% | |
| 1960 | 7,256,311 | 75.0% | |
| 1970 | 5,740,891 | 61.7% | |
| 1980 | 5,149,572 | 39.0% | |
| 1990 | 4,350,403 | 22.9% | |
| 2000 | 4,915,557 | 15.8% | |
| 2010 | 4,817,437 | 12.1% | |
| 2016 | 4,785,267 | 10.9% | |
| Source:[37][28][38][39] | |||
| Birthplace | Population in 2010 |
Percent in 2010 |
Population in 2016 |
Percent in 2016 | |
|---|---|---|---|---|---|
| Totals, European-born | 4,817,437 | 12.0% | 4,785,267 | 10.9% | |
| Northern Europe | 923,564 | 2.3% | 950,872 | 2.2% | |
| United Kingdom | 669,794 | 1.7% | 696,896 | 1.6% | |
| Ireland | 124,457 | 0.3% | 125,840 | 0.3% | |
| Other Northern Europe | 129,313 | 0.3% | 128,136 | 0.3% | |
| Western Europe | 961,791 | 2.4% | 939,383 | 2.1% | |
| Germany | 604,616 | 1.5% | 563,985 | 1.3% | |
| France | 147,959 | 0.4% | 175,250 | 0.4% | |
| Other Western Europe | 209,216 | 0.5% | 200,148 | 0.4% | |
| Southern Europe | 779,294 | 2.0% | 760,352 | 1.7% | |
| Italy | 364,972 | 0.9% | 335,763 | 0.8% | |
| Portugal | 189,333 | 0.5% | 176,638 | 0.4% | |
| Other Southern Europe | 224,989 | 0.6% | 247,951 | 0.5% | |
| Eastern Europe | 2,143,055 | 5.4% | 2,122,951 | 4.9% | |
| Poland | 475,503 | 1.2% | 424,928 | 1.0% | |
| Russia | 383,166 | 1.0% | 397,236 | 0.9% | |
| Other Eastern Europe | 1,284,286 | 3.2% | 1,300,787 | 3.0% | |
| Other Europe (no country specified) | 9,733 | 0.0% | 11,709 | 0.0% | |
Source: 2010 and 2016[40]
| |||||
Demographics

The New York City Metropolitan Area is home to the largest European population in the United States.[41]
The numbers below give numbers of European Americans as measured by the U.S. Census in 1980, 1990, and 2000. The numbers are measured according to declarations in census responses. This leads to uncertainty over the real meaning of the figures: For instance, as can be seen, according to these figures, the European American population dropped 40 million in ten years, but in fact, this is a reflection of changing census responses. In particular, it reflects the increased popularity of the "American" option following its inclusion as an example in the 2000 census forms.[Citation needed]
Breakdowns of the European American population into sub-components is a difficult and rather arbitrary exercise. Farley (1991) argues that "because of ethnic intermarriage, the numerous generations that separate respondents from their forebears and the apparent unimportance to many whites of European origin, responses appear quite inconsistent".[42]
In particular, a large majority of European Americans have ancestry from a number of different countries and the response to a single "ancestry" gives little indication of the backgrounds of Americans today. When only prompted for a single response, the examples given on the census forms and a pride in identifying the more distinctive parts of one's heritage are important factors; these will likely adversely affect the numbers reporting ancestries from the British Isles. Multiple response ancestry data often greatly increase the numbers reporting for the main ancestry groups, although Farley goes as far to conclude that "no simple question will distinguish those who identify strongly with a specific European group from those who report symbolic or imagined ethnicity." He highlights responses in the Current Population Survey (1973) where for the main "old" ancestry groups (e.g., German, Irish, English, and French), over 40% change their reported ancestry over the six-month period between survey waves (page 422).[Citation needed]
The largest self-reported ancestries in 2000, reporting over 5 million members, were in order: German, Irish, English, American, Italian, French, and Polish. They have different distributions within the United States; in general, the northern half of the United States from Pennsylvania westward is dominated by German ancestry, and the southern-half by English and American. Irish may be found throughout the entire country. Italian ancestry is most common in the Northeast, Polish in the Great Lakes Region and the Northeast, and French in New England and Louisiana. U.S. Census Bureau statisticians estimate that approximately 62 percent of European Americans today are either wholly or partly of English, Welsh, Irish, or Scottish ancestry. Approximately 86% of European Americans today are of Northwestern and Central European ancestry, and 14% are of Southern European, Southeastern European, Eastern European, and Euro-Latino descent.[Citation needed]
Ancestral origins
Script error: No such module "Labelled list hatnote".
| Ancestral origin | 1980 / %[43] | 1990 / %[44] | 2000 / %[45] | 2016 (est.) / %[46] | Pop. change 1990–2016 | ||||
|---|---|---|---|---|---|---|---|---|---|
| United States population | 226,545,805 | 100.0 | 248,709,873 | 100.0 | 281,421,906 | 100.0 | 318,558,162 | 100.0 | Template:Gain28.08% |
| Total ancestries reported | 188,302,438 | 83.1 | 248,709,873 | 100.0 | 287,304,886 | 102.1 | |||
| Acadian/Cajun | 668,271 | 0.3 | 85,414 | 0.0 | 115,312 | 0.04 | Template:Loss82.74% | ||
| Albanian | 38,658 | 0.02 | 47,710 | 0.0 | 113,661 | 0.0 | 191,463 | 0.06 | Template:Gain301.31% |
| Alsatian | 42,390 | 0.02 | 16,465 | 0.0 | 15,601 | 0.0 | 11,107 | 0.00 | Template:Loss32.54% |
| American | 12,395,999 | 5.0 | 20,625,093 | 7.3 | 22,097,012 | 6.94 | Template:Gain78.26% | ||
| Austrian | 948,558 | 0.42 | 864,783 | 0.3 | 735,128 | 0.3 | 702,772 | 0.22 | Template:Loss18.73% |
| Basque | 43,140 | 0.0 | 47,956 | 0.0 | 57,793 | 0.0 | |||
| Bavarian | 4,348 | 0.0 | |||||||
| Belarusian | 7,381 | 0.00 | 4,277 | 0.0 | |||||
| Belgian | 360,277 | 0.16 | 380,498Template:Refn | 0.2 | 360,642 | 0.1 | 359,121 | 0.11 | Template:Loss5.62% |
| British | 1,119,154 | 0.4 | 1,085,720 | 0.4 | 1,370,222 | 0.43 | Template:Gain22.43% | ||
| Bulgarian | 42,504 | 0.02 | 29,595 | 0.0 | 55,489 | 0.0 | 98,410 | 0.03 | Template:Gain232.52% |
| Carpatho Rusyn | 7,602 | 0.0 | 7,921 | 0.00 | Template:Gain4.20% | ||||
| Celtic | 29,652 | 0.0 | 65,638 | 0.0 | 50,058 | 0.02 | Template:Gain68.82% | ||
| Cornish | 3,991 | 0.0 | |||||||
| Croatian | 252,970 | 0.11 | 544,270 | 0.2 | 374,241 | 0.1 | 410,003 | 0.13 | Template:Loss24.67% |
| Cypriot | 6,053 | 0.00 | 4,897 | 0.0 | 7,663 | 0.0 | 7,332 | 0.00 | Template:Gain49.72% |
| Czech | 1,892,456 | 0.84 | 1,296,411Template:Refn | 0.5 | 1,262,527 | 0.4 | 1,435,359 | 0.45 | Template:Gain10.72% |
| Czechoslovakian | 315,285 | 0.1 | 441,403 | 0.2 | 300,424 | 0.09 | Template:Loss4.71% | ||
| Danish | 1,518,273 | 0.67 | 1,634,669 | 0.7 | 1,430,897 | 0.5 | 1,297,738 | 0.41 | Template:Loss20.61% |
| Dutch | 6,304,499 | 2.78 | 6,227,089 | 2.5 | 4,542,494 | 1.6 | 4,210,787 | 1.32 | Template:Loss32.38% |
| Eastern EuropeanTemplate:Refn | 62,404 | 0.03 | 132,332 | 0.1 | 546,280 | 0.17 | |||
| English | 49,598,035 | 21.89 | 32,651,788 | 13.1 | 24,515,138 | 8.7 | 24,426,623 | 7.67 | Template:Loss25.19% |
| Estonian | 25,994 | 0.01 | 26,762 | 0.0 | 25,034 | 0.0 | 27,864 | 0.01 | Template:Gain4.12% |
| EuropeanTemplate:Refn | 175,461 | 0.08 | 466,718 | 0.2 | 1,968,696 | 0.7 | 3,922,881 | 1.23 | |
| Finnish | 615,872 | 0.27 | 658,870 | 0.3 | 623,573 | 0.2 | 645,053 | 0.20 | Template:Loss2.10% |
| Flemish | 14,157 | 0.0 | |||||||
| French (except Basque) | 12,892,246 | 5.69 | 10,320,935 | 4.1 | 8,309,908 | 3.0 | 8,151,499 | 2.56 | Template:Loss21.02% |
| French Canadian | 780,488 | 0.34 | 2,167,127 | 0.9 | 2,349,684 | 0.8 | 2,084,903 | 0.65 | Template:Loss3.79% |
| German | 49,224,146 | 21.73 | 57,947,171Template:Refn | 23.3 | 42,885,162 | 15.2 | 45,879,360 | 14.40 | Template:Loss20.83% |
| German Russian | 10,153 | 0.0 | 10,535 | 0.0 | 23,772 | 0.01 | Template:Gain134.14% | ||
| Greek | 959,856 | 0.42 | 1,110,373 | 0.4 | 1,153,307 | 0.4 | 1,282,655 | 0.40 | Template:Gain15.52% |
| Hungarian | 1,776,902 | 0.78 | 1,582,302 | 0.6 | 1,398,724 | 0.5 | 1,423,144 | 0.45 | Template:Loss10.06% |
| Icelandic | 32,586 | 0.01 | 40,529 | 0.0 | 42,716 | 0.0 | 50,572 | 0.02 | Template:Gain24.78% |
| Irish | 40,165,702 | 17.73 | 38,735,539Template:Refn | 15.6 | 30,528,492 | 10.8 | 33,093,550 | 10.39 | Template:Loss14.57% |
| Italian | 12,183,692 | 5.38 | 14,664,550Template:Refn | 5.9 | 15,723,555 | 5.6 | 17,174,741 | 5.39 | Template:Gain17.12% |
| Latvian | 92,141 | 0.04 | 100,331 | 0.0 | 87,564 | 0.0 | 86,128 | 0.03 | Template:Loss14.16% |
| Lithuanian | 742,776 | 0.33 | 811,865 | 0.3 | 659,992 | 0.2 | 648,514 | 0.20 | Template:Loss20.12% |
| Luxemburger | 49,994 | 0.02 | 49,061 | 0.0 | 45,139 | 0.0 | 40,760 | 0.01 | Template:Loss16.92% |
| Macedonian | 20,365 | 0.0 | 38,051 | 0.0 | 57,221 | 0.02 | Template:Gain180.98% | ||
| Maltese | 31,645 | 0.01 | 39,600 | 0.0 | 40,159 | 0.0 | 39,985 | 0.01 | Template:Gain0.97% |
| Manx | 9,220 | 0.00 | 6,317 | 0.0 | 6,955 | 0.0 | |||
| Moravian | 3,781 | 0.0 | |||||||
| Northern Irish | 16,418 | 0.01 | 4,009 | 0.0 | 3,693 | 0.0 | |||
| Norwegian | 3,453,839 | 1.52 | 3,869,395 | 1.6 | 4,477,725 | 1.6 | 4,454,964 | 1.40 | Template:Gain15.13% |
| Pennsylvania German | 305,841 | 0.1 | 255,807 | 0.1 | 301,483 | 0.09 | Template:Loss1.42% | ||
| Polish | 8,228,037 | 3.63 | 9,366,106 | 3.8 | 8,977,444 | 3.2 | 9,344,126 | 2.93 | Template:Loss0.23% |
| Portuguese | 1,024,351 | 0.45 | 1,153,351 | 0.5 | 1,177,112 | 0.4 | 1,367,476 | 0.43 | Template:Gain18.57% |
| Prussian | 25,469 | 0.0 | |||||||
| Romanian | 315,258 | 0.14 | 365,544 | 0.1 | 367,310 | 0.1 | 459,841 | 0.14 | Template:Gain25.80% |
| Russian | 2,781,432 | 1.23 | 2,952,987 | 1.2 | 2,652,214 | 0.9 | 2,795,443 | 0.88 | Template:Loss5.34% |
| Saxon | 4,519 | 0.0 | |||||||
| Scandinavian | 475,007 | 0.21 | 678,880 | 0.3 | 425,099 | 0.2 | 629,819 | 0.20 | Template:Loss7.23% |
| Scotch-Irish | 5,617,773 | 2.3 | 4,319,232 | 1.5 | 3,056,848 | 0.96 | Template:Loss45.59% | ||
| Scottish | 10,048,816 | 4.44 | 5,393,581 | 2.2 | 4,890,581 | 1.7 | 5,457,798 | 1.71 | Template:Gain1.19% |
| Serbian | 100,941 | 0.04 | 116,795 | 0.0 | 140,337 | 0.0 | 189,425 | 0.06 | Template:Gain62.19% |
| Sicilian | 50,389 | 0.0 | |||||||
| Slavic | 172,696 | 0.08 | 76,931 | 0.0 | 127,137 | 0.0 | 125,571 | 0.04 | Template:Gain63.23% |
| Slovak | 776,806 | 0.34 | 1,882,897 | 0.8 | 797,764 | 0.3 | 714,557 | 0.22 | Template:Loss62.05% |
| Slovene | 126,463 | 0.06 | 124,437 | 0.1 | 176,691 | 0.1 | 172,511 | 0.05 | Template:Gain38.63% |
| Soviet | 7,729 | 0.0 | 2,459 | 0.00 | Template:Loss68.18% | ||||
| Spaniard | 94,528 | 0.04 | 360,935 | 0.1 | 299,948[47] | 0.1 | 768,252[48] | 0.24 | Template:Gain112.85% |
| Swedish | 4,345,392 | 1.92 | 4,680,863 | 1.9 | 3,998,310 | 1.4 | 3,908,762 | 1.23 | Template:Loss16.49% |
| Swiss | 981,543 | 0.43 | 1,045,495 | 0.4 | 911,502 | 0.3 | 937,376 | 0.29 | Template:Loss10.34% |
| Ukrainian | 730,056 | 0.32 | 740,723 | 0.3 | 892,922 | 0.3 | 986,597 | 0.31 | Template:Gain33.19% |
| Welsh | 1,664,598 | 0.73 | 2,033,893 | 0.8 | 1,753,794 | 0.6 | 1,805,577 | 0.57 | Template:Loss11.23% |
| West German | 3,885 | 0.0 | |||||||
| Yugoslavian | 360,174 | 0.16 | 257,994 | 0.1 | 328,547 | 0.1 | 276,360 | 0.09 | Template:Gain7.12% |
Culture

American cultural icons, apple pie, baseball, and the American flag. All have European influence primarily from the British.
As the largest component of the American population, the overall American culture deeply reflects the European-influenced culture that predates the United States of America as an independent state. Much of American culture shows influences from the diverse nations of the United Kingdom and Ireland, such as the English, Irish, Cornish, Manx, Scotch-Irish, Scottish and Welsh. Colonial ties to the United Kingdom spread the English language, legal system and other cultural attributes.[2] Scholar David Hackett Fischer asserts in Albion's Seed: Four British Folkways in America that the folkways of four groups of people who moved from distinct regions of the United Kingdom to the United States persisted and provide a substantial cultural basis for much of the modern United States.[49] Fischer explains "the origins and stability of a social system which for two centuries has remained stubbornly democratic in its politics, capitalist in its economy, libertarian in its laws and individualist in its society and pluralistic in its culture."[50]
Much of the European-American cultural lineage can be traced back to Western and Northern Europe, which is institutionalized in the government, traditions, and civic education in the United States.[51] Since most later European Americans have assimilated into American culture, many Americans of European ancestry now generally express their personal ethnic ties sporadically and symbolically and do not consider their specific ethnic origins to be essential to their identity; however, European American ethnic expression has been revived since the 1960s.[52] Some European Americans such as Italians, Greeks, Poles, Germans, Ukrainians, Irish, and others have maintained high levels of ethnic identity. In the 1960s, the melting pot ideal to some extent gave way to increased interest in cultural pluralism, strengthening affirmations of ethnic identity among various American ethnic groups, European as well as others.[52]
Law
The American legal system also has its roots in French philosophy with the separation of powers and the federal system[53] along with English law in common law.[54] For example, elements of the Magna Carta in it contain provisions on criminal law that were incorporated into the Bill of Rights of the U.S. Constitution. It as well as other documents had elements influencing and incorporated into the United States Constitution.[Citation needed]
Cuisine
Script error: No such module "Labelled list hatnote".

.jpg)
Hamburgers were invented by German immigrants.
- Apple pie – New England was the first region to experience large-scale English colonization in the early 17th century, beginning in 1620, and it was dominated by East Anglian Calvinists, better known as the Puritans. Baking was a particular favorite of the New Englanders and was the origin of dishes seen today as quintessentially "American", such as apple pie and the oven-roasted Thanksgiving turkey, a bird that although not found in Europe has become linked in tradition and symbolism to the early European immigrants.[55] "As American as apple pie" is a well-known phrase used to suggest that something is all-American.
- Hamburger – Although the origins of the hamburger, including the country in which it was first served, are subjects of debate, the hamburger first became widely marketed in the United States[56] and has been internationally known for decades as a symbol of American fast food.
- Maxwell Street Polish Hot Dog – Consists of a grilled or fried length of Polish sausage topped with grilled onions and yellow mustard and optional pickled whole, green sport peppers, served on a bun. The sandwich traces its origins to Chicago's Maxwell Street market, and has been called one of "the classic foods synonymous with Chicago".[57]
- Buffalo wings – Invented in 1964 at Anchor Bar in Buffalo, New York by Italian-American Teressa Bellissimo. Now popular all over the country, it has become a symbol of American cuisine.[58]
- Hot dog – Hot dogs were brought to New York by German immigrants.[59]
- Pizza – Italian immigrants from Naples brought pizza to the United States.[60]
- Fried chicken – Scottish immigrants brought fried chicken to the Southern United States. Enslaved African Americans began cooking fried chicken based on the recipes from white Scottish slaveholders.[61]
Thanksgiving
- Thanksgiving – In the United States, it has become a national secular holiday (official since 1863) with religious origins. The first Thanksgiving was celebrated by English settlers to give thanks to God and the Native Americans for helping the Pilgrims of Plymouth Colony survive the brutal winter.[62] The modern Thanksgiving holiday traces its origins from a 1621 celebration at the Plymouth Plantation, where the Plymouth settlers held a harvest feast with the Native Americans after a successful growing season. William Bradford is credited as the first to proclaim the American cultural event which is generally referred to as the "First Thanksgiving".
Sports
Script error: No such module "Labelled list hatnote".
- Baseball – The earliest recorded game of base-ball involved the family of the Prince of Wales, played indoors in London in November 1748. The Prince is reported as playing "Bass-Ball" again in September 1749 in Walton-on-Thames, Surrey, against Lord Middlesex.[63] English lawyer William Bray recorded a game of baseball on Easter Monday 1755 in Guildford, Surrey; Bray's diary was verified as authentic in September 2008.[64][65] This early form of the game was apparently brought to North America by English immigrants. The first appearance of the term that exists in print was in "A Little Pretty Pocket-Book" in 1744, where it is called Base-Ball.
- American football – can be traced to modified early versions of rugby football played in England and Canadian football mixed with and ultimately changed by American innovations which led over time to the finished version of the game from 1876 to now. The basic set of rules were first developed in American universities in the mid-19th century.[66]
- Golf - Golf originated from Scotland in the 15th century, the first course in Scotland being St Andrews. The first golf course in America was founded by a Scot John Reid in 1888, and was named after the first Scottish golf club Saint Andrew's Golf Club located in Yonkers, New York, from here golf soared as a national hobby, and by the turn of the 20th Century there was more than 1,000 golf courses in North America.[67]
Music
Another area of cultural influence are American Patriotic songs:
- American National Anthem – takes its melody from the 18th-century English song "To Anacreon in Heaven" written by John Stafford Smith for the Anacreontic Society, a men's social club in London and lyrics written by American Francis Scott Key. This became a well-known and recognized patriotic song throughout the United States, which was officially designated as the American national anthem in 1931.[68][69][70]
Before 1931, other songs served as the hymns of American officialdom.
- Amazing Grace – written by English poet and clergyman John Newton. Popular among African Americans, it became an icon in American culture and has been used for a variety of secular purposes and marketing campaigns.[71]
- Hail, Columbia – initial presidential inauguration song up until early 20th century. Now used for the Vice President.
- Battle Hymn of the Republic – Patriotic song sung during the civil war time between 1861 and 1865.
Admixture in non-Latino whites
Script error: No such module "Labelled list hatnote". Some white Americans have varying amounts of Amerindian and sub-Saharan African ancestry. In a recent study, Gonçalves et al. 2007 reported sub-Saharan and Amerindian mtDna lineages at a frequency of 3.1% (respectively 0.9% and 2.2%) in European Americans, although that frequency may be scattered by region.[72]
DNA analysis on white Americans by geneticist Mark D. Shriver showed an average of 0.7% Sub-Saharan African admixture and 3.2% Native American admixture.[73] The same author, in another study, claimed that about 30% of all White Americans, approximately 66 million people, have a median of 2.3% of Sub-Saharan African admixture.[74] Later, Shriver retracted his statement, saying that actually around 5% of White Americans exhibit some detectable level of African ancestry.[75]
From the 23andMe database, about 5 to at least 13 percent of self-identified white American Southerners have greater than 1 percent African ancestry.[76] Southern states with the highest African American populations tended to have the highest percentages of hidden African ancestry.[77] White Americans (European Americans) on average are: "98.6 percent European, 0.19 percent African and 0.18 percent Native American." Inferred British/Irish ancestry is found in European Americans from all states at mean proportions of above 20%, and represents a majority of ancestry, above 50% mean proportion, in states such as Mississippi, Arkansas, and Tennessee. Scandinavian ancestry in European Americans is highly localized; most states show only trace mean proportions of Scandinavian ancestry, while it comprises a significant proportion, upwards of 10%, of ancestry in European Americans from Minnesota and the Dakotas.[76][77]
See also
- American ancestry
- Anglo
- Ethnic groups in Europe
- European Canadians
- European Oceanians
- Immigration to the United States
- Melting pot
- Non-Latino whites
- Stereotypes of white Americans
- White Americans
- White Anglo-Saxon Protestant
- White ethnic
- White Latino Americans
- White Southerners
- Romani Americans
- American Jews
- European Mexicans
- White Americans in California
- White Latin Americans
- Colonial history of the United States
- Hispanic and Latino Americans
- White demographic decline
Notes
- ↑ Germany in this time period consisted of a large number of separate countries, the largest of which was Prussia.
- ↑ The Other category probably contains mostly English ancestry settlers; but the loss of several states' census records in makes closer estimates difficult. The summaries of the 1790 and 1800 census from all states surveyed.
- ↑ Total represents total immigration over the approximately 130-year span of colonial existence of the U.S. colonies as found in the 1790 census. At the time of the American Revolution the foreign born population was estimated to be from 300,000 to 400,000.
References
- ↑ "Euro-American". Merriam Webster Dictionary. Merriam-Webster, Incorporated. http://www.merriam-webster.com/dictionary/euro-american.
- ↑ 2.0 2.1 James B. Minahan (March 14, 2013). "Americans of European descent". Ethnic Groups of the Americas: An Encyclopedia. pp. 17–18. ISBN 9781610691642. https://books.google.com/books?id=OJilCCGFCTYC&q=European+American&pg=PR9.
- ↑ "A Spanish Expedition Established St. Augustine in Florida". Library of Congress. http://www.americaslibrary.gov/jb/colonial/jb_colonial_augustin_1.html.
- ↑ Figueredo, D. H. (2007). Latino Chronology. ISBN 9780313341540. https://books.google.com/books?id=TWX5d27NkFgC&pg=PT35. Retrieved February 4, 2015.
- ↑ SELECTED SOCIAL CHARACTERISTICS IN THE UNITED STATES – 2016 American Community Survey 1-Year Estimates
- ↑ Sharing the Dream: White Males in a Multicultural America By Dominic J. Pulera.
- ↑ Farley, Reynolds (1991). "The New Census Question about Ancestry: What Did It Tell Us?". Demography 28 (3): 411–29. doi:10.2307/2061465. PMID 1936376.
- ↑ Stanley Lieberson and Lawrence Santi, "The Use of Nativity Data to Estimate Ethnic Characteristics and Patterns", Social Science Research, Vol. 14, No. 1 (1985), pp. 44-6.
- ↑ Stanley Lieberson and Mary C. Waters, "Ethnic Groups in Flux: The Changing Ethnic Responses of American Whites", Annals of the American Academy of Political and Social Science, Vol. 487, No. 79 (September 1986), pp. 82–86.
- ↑ Bryc, Katarzyna; Durand, Eric Y.; Macpherson, J. Michael; Reich, David; Mountain, Joanna L. (2015). "The Genetic Ancestry of African Americans, Latinos, and European Americans across the United States". The American Journal of Human Genetics 96 (1): 37–53. doi:10.1016/j.ajhg.2014.11.010. ISSN 0002-9297. PMC 4289685. PMID 25529636.
- ↑ Ancestry: 2000 – Census Bureau
- ↑ CPS Publications (October 26, 1995). "A Test of Methods For Collecting Racial and Ethnic Information: May 1995". Press release. http://www.bls.census.gov/cps/pub/ethnic_0595.htm. Retrieved March 24, 2015.
- ↑ "The Meanings of Race in the New Genomics: Implications for Health Disparities Research". Yale University. May 24, 2001. p. 54. http://www.yale.edu/yjhple/issues/vi-spr01/docs/lee.pdf.
- ↑ Bhopal, Raj. (1998). "White, European, Western, Caucasian or What? Inappropriate Labeling in Research on Race, Ethnicity and Health". Am J Public Health 88 (9): 1303–7. doi:10.2105/ajph.88.9.1303. PMC 1509085. PMID 9736867.
- ↑ Adair, Margo (1990). "Challenging White Supremacy Workshop". cwsworkshop.org. http://cwsworkshop.org/pdfs/WIWP2/3Wonder_Breading.PDF.
- ↑ Victor C. Romero (2014). "The Criminalization of Undocumented Migrants". In Lois Ann Lorentzen. Hidden Lives and Human Rights in the United States (3 volumes): Understanding the Controversies and Tragedies of Undocumented Immigration. Praeger Publications. p. 16. ISBN 978-1440828478. "The 1924 act also sought to curtail the large number of eastern and southern European migrants who began entering the United States in 1890. Through the National Origins Quota formula, the act pegged future immigration at up to 2 percent of the number of foreign-born persons from a particular country already in the United States as of the 1890 census. Through race-neutral in language, the formula favored northwestern Europeans by using the 1890 census as its referent"
- ↑ Paul Spickard (2007). "The Great Wave, 1870-1930". Almost All Aliens: Immigration, Race, and Colonialism in American History and Identity: Race, Colonialism, and Immigration in American History and Identity. Routledge. p. 176. ISBN 978-0415935937. "Although many histories of immigration describe this period from the 1870s to the 1920s as one when the sources of migrants shifted from Northwest Europe to Southern and Eastern Europe - “Old Immigration” versus the “New Immigration,” Northwest Europeans continued to come and stay in very large numbers."
- ↑ Benjamin Bailey (2002). "Introduction". Language, Race, and Negotiation of Identity: A Study of Dominican Americans. University of Massachusetts Amherst. p. 15. "During the heightened immigration associated with the 1880-1920 period, many doubted that the largely Southern and Eastern European newcomers would ever assimilate to the culture of the dominant groups, who were of predominantly Northwestern European origin ... Social differences between these immigrants and European Americans who were already in America were perceived as insurmountable."
- ↑ Data From Ann Arbor, MI: Inter-university Consortium for Political and Social Research (ICPS).
- ↑ The source: a guidebook to American genealogy. By Loretto Dennis Szucs, Sandra Hargreaves Luebking
- ↑ Guns Germs & Steel: Variables. Smallpox - PBS
- ↑ EUROPEAN COLONIZATION OF NORTH AMERICA
- ↑ United States History - The First Europeans
- ↑ Waters, Mary C.; Ueda, Reed; Marrow, Helen B. (June 30, 2009). The New Americans. ISBN 9780674044937. https://books.google.com/books?id=z-y_q4J_eCEC&q=52+million+europeans+immigrated+to+united+states&pg=PA15. Retrieved February 4, 2015.
- ↑ Raymond L. Cohn (August 15, 2001). "Immigration to the United States". EH.Net Encyclopedia. http://www.eh.net/encyclopedia/article/cohn.immigration.us.
- ↑ "MPI Data Hub Graph". migrationinformation.org. http://www.migrationinformation.org/datahub/charts/fb.2.shtml.
- ↑ Loretto Dennis Szucs; Sandra Hargreaves Luebking (2006). The Source: A Guidebook to American Genealogy. Ancestry Publishing. p. 367. ISBN 978-1-59331-277-0. https://archive.org/details/sourceguidebooko00lore. Retrieved March 11, 2016.
- ↑ 28.0 28.1 "The Foreign-Born Population in the United States: 2010". US Census Bureau. May 2012. https://www.census.gov/prod/2012pubs/acs-19.pdf.
- ↑ Statistical Abstract of the United States (Page: 98) Immigration from 1820
- ↑ Almost All Aliens: Immigration, Race, and Colonialism in American History ... By Paul Spickard
- ↑ Statistical Abstract of the United States (Page: 89)
- ↑ Statistical Abstract of the United States Immigration by country of origin 1851–1940 (Page: 107)
- ↑ Statistical Abstract of the United States (Page: 92)
- ↑ Public Opinion and the Immigrant: Mass Media Coverage, 1880–1980 Script error: No such module "webarchive". Rita James Simon
- ↑ Wagner, Francis S; Wagner-Jones, Christina (1985). Nation-building in the United States. ISBN 978-0-912404-12-7. https://books.google.com/books?id=phsWAQAAIAAJ&q=Nation-building+in+the+United+States.
- ↑ "European emigration statistics". http://www.spartacus.schoolnet.co.uk/USAEStotalS.htm.
- ↑ "Population Division: Historical census statistics on the foreign-born population of the United States: 1850 to 2000 (Working Paper No. 81)". US Census Bureau. February 2006. https://www.census.gov/population/www/documentation/twps0081/twps0081.pdf.
- ↑ "Foreign-Born Population by Country of Birth: 1960, 1970, 1980, and 1990 plus 2000, 2006–2011" (XLSX). Migration Policy Institute. http://www.migrationpolicy.org/sites/default/files/datahub/MPIDataHub-Region-birth-1960.xlsx.
- ↑ United States Demographics & Social Script error: No such module "webarchive". 2015% Foreign-Born population in the United States
- ↑ "PLACE OF BIRTH FOR THE FOREIGN-BORN POPULATION IN THE UNITED STATES. Universe: Foreign-born population excluding population born at sea". factfinder.census.gov. https://factfinder.census.gov/faces/tableservices/jsf/pages/productview.xhtml?pid=ACS_15_1YR_B05006&prodType=table.
- ↑ "Yearbook of Immigration Statistics: 2011 Supplemental Table 2". U.S. Department of Homeland Security. https://www.dhs.gov/sites/default/files/publications/table2_2.xls.
- ↑ Farley, Reynolds (1991). "The New Census Question about Ancestry: What Did It Tell Us?". Demography 28 (3): 411–429. doi:10.2307/2061465. PMID 1936376.
- ↑ "Ancestry of the Population by State: 1980 – Table 2". United States Census Bureau. https://www.census.gov/population/www/censusdata/files/pc80-s1-10/tab02.pdf.
- ↑ "1990 Census of Population – Detailed Ancestry Groups for States". United States Census Bureau. https://www2.census.gov/library/publications/decennial/1990/cp-s-1-2.pdf.
- ↑ "Ancestry: 2000". United States Census Bureau. https://factfinder.census.gov/bkmk/table/1.0/en/DEC/00_SF3/QTP13.
- ↑ "2016 American Community Survey – People Reporting Ancestry". United States Census Bureau. https://factfinder.census.gov/bkmk/table/1.0/en/ACS/16_5YR/B04006.
- ↑ "Ancestry: 2000 – Table 2". United States Census Bureau. https://www.census.gov/history/pdf/ancestry.pdf.
- ↑ "2016 American Community Survey – Hispanic or Latino Origin". United States Census Bureau. https://factfinder.census.gov/bkmk/table/1.0/en/ACS/16_5YR/B03001.
- ↑ David Hackett Fischer, Albion's Seed (Oxford University Press, 1989), p. 6
- ↑ Hackett Fischer, David. Albion's Seed Oxford University Press, 1989.
- ↑ Kirk, Russell. The Heritage Lecture Series. "America Should Strengthen its European Cultural Roots." Washington D.C:1949
- ↑ 52.0 52.1 Randolph, Gayle (2007). "Why Study European Immigrants". Iowa State University. http://frontpage.uwsuper.edu/Soc330b/Chap11_files/frame.htm.
- ↑ Separation of powers#Checks and balances
- ↑ "Features – Sources of United States of America Legal Information in Languages Other than English – LLRX.com". http://www.llrx.com/features/otherthanenglish.htm. LLRX
- ↑ Fischer, pp. 74, 114, 134–39.
- ↑ according to a theory; see Hamburger
- ↑ Clark, Sandy Thorne. (June 26, 2006), "Getting a taste of Chicago: City's signature flavors have tourists and locals lining up for more, more, more", Chicago Sun-Times, S1.
- ↑ The Italian American Cookbook: A Feast of Food from a Great American Cooking – By John Mariani, Galina Mariani
- ↑ https://www.history.com/.amp/news/break-out-the-buns-the-history-of-the-hot-dog
- ↑ https://www.history.com/.amp/news/a-slice-of-history-pizza-through-the-ages
- ↑ https://www.bbc.com/travel/article/20201012-the-surprising-origin-of-fried-chicken
- ↑ William Bradford, Of Plymouth Plantation 1620–1647, 85
- ↑ Sulat, Nate (July 26, 2013). "Why isn't baseball more popular in the UK?". BBC News Online (New York). https://www.bbc.co.uk/news/magazine-23425907.
- ↑ "UK – England – Baseball 'origin' uncovered". BBC. September 17, 2008. http://news.bbc.co.uk/2/hi/uk_news/england/7622026.stm.
- ↑ "BBC – South Today – Features – Baseball history". BBC. http://www.bbc.co.uk/southtoday/content/articles/2008/09/09/baseball_feature.shtml.
- ↑ Pope, S. W.; Pope, Steven W. (1997). The New American Sport History. ISBN 9780252065675. https://books.google.com/books?id=dhBw1RpvhLwC&pg=PA89. Retrieved February 4, 2015.
- ↑ "The history of golf" (in en-GB). 2004-07-12. http://news.bbc.co.uk/sportacademy/hi/sa/golf/rules/history/newsid_3874000/3874891.stm.
- ↑ "John Stafford Smith: Composer of the Star Spangled Banner". visit-gloucestershire.co.uk. http://www.visit-gloucestershire.co.uk/gloucester/smith.htm.
- ↑ "Fort McHenry: Birthplace of Our National Anthem". bcpl.net. http://www.bcpl.net/~etowner/anthem.html.
- ↑ Lesley Nelson. "Star Spangled Banner". contemplator.com. http://www.contemplator.com/america/ssbanner.html.
- ↑ "Amazing Grace". NPR. December 29, 2002. https://www.npr.org/templates/story/story.php?storyId=894060.
- ↑ Sample of 1387 American Caucasian individuals catalogued in the FBI mtDNA population database, Gonçalves et al. 2007, Sex-biased gene flow in African Americans but not in American Caucasians Script error: No such module "webarchive".
- ↑ Shriver, et al., "Skin pigmentation, biogeographical ancestry and admixture mapping Script error: No such module "webarchive"., Hum Genet (2003) 112 : 387–39.
- ↑ Sailer, Steve (May 8, 2002). "Analysis: White prof finds he's not.". United Press International. http://www.upi.com/Top_News/2002/05/08/Analysis-White-prof-finds-hes-not-2/UPI-53561020909970.
- ↑ Wootan, Jim (December 2003). "Race Reversal Man Lives as 'Black' for 50 Years – Then Finds Out He's Probably Not". ABC News. https://abcnews.go.com/sections/Nightline/SciTech/racial_identity_031228.html.
- ↑ 76.0 76.1 Template:Cite bioRxiv
- ↑ 77.0 77.1 Scott Hadly, "Hidden African Ancestry Redux", DNA USA* Script error: No such module "webarchive"., 23andMe, March 4, 2014.
External links
 Media related to Script error: No such module "Commons link". at Wikimedia Commons
| ||||||||||||||||||||||||||
| |||||||||||||||||||||||||||||||||||||
| ||||||||||||||||||||||||||
| ||||||||||||||||||||||||||||||||||||||||
Script error: No such module "Authority control".